Tableau Dashboard: G20 Consumer Behavior Insights
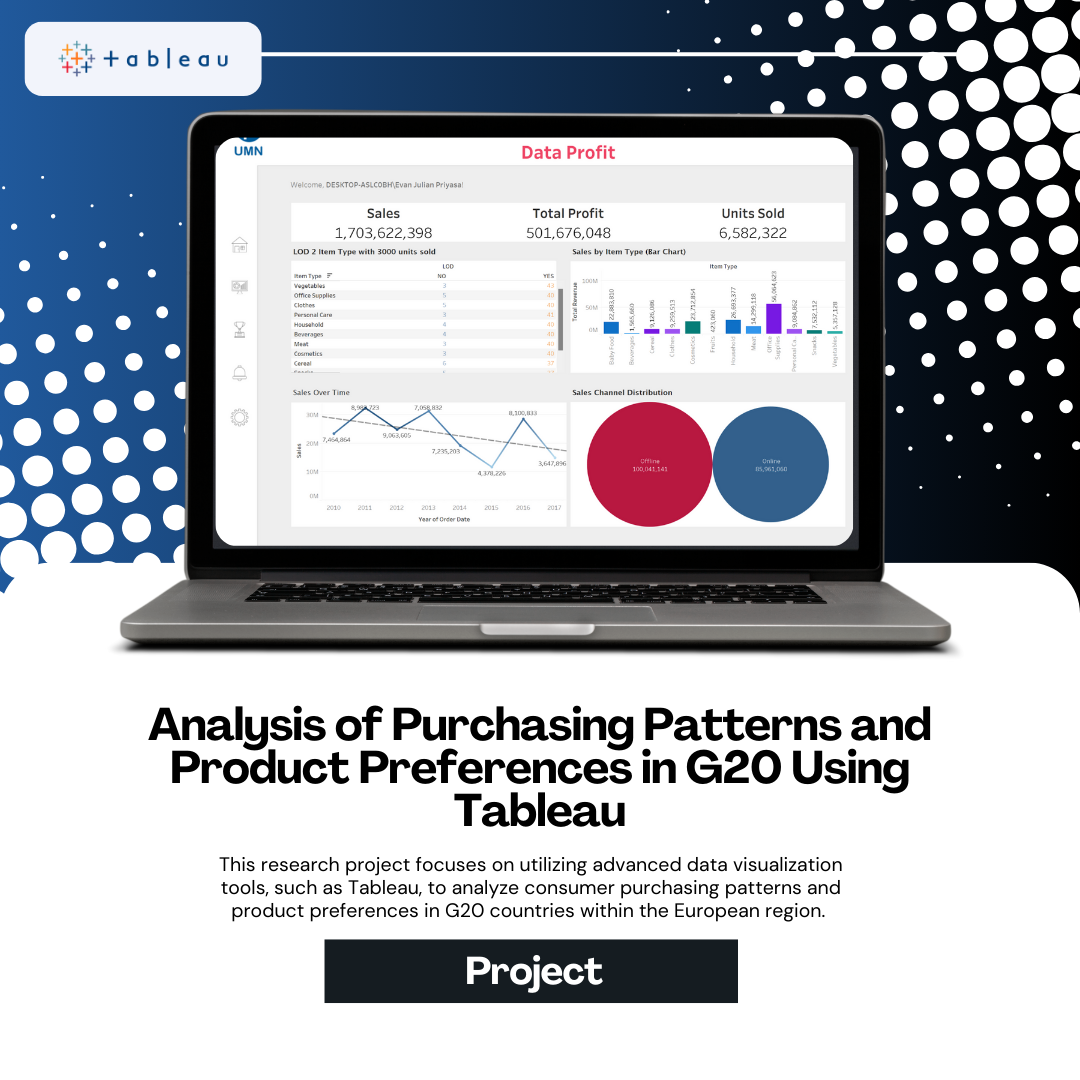
Figure 1: Main Tableau Dashboard Interface.
This research explores company sales data in G20 countries in the European Region, focusing on sales patterns, consumer preferences, and factors influencing purchasing decisions. Through comprehensive analysis, key findings include seasonal sales patterns, popular products, and influencing factors that provide a strong foundation for developing more effective business strategies. The conclusion emphasizes the importance of a deep understanding of consumer behavior and product preferences to enhance company competitiveness, while recommendations focus on optimizing e-commerce strategies, expanding sales channels, and product innovation. By taking these steps, companies can achieve greater success in sales in G20 countries in the European Region.
1. The Problem: Uncovering Insights from Complex Global Consumer Data
With consumer behavior constantly evolving, especially in emerging markets, it became increasingly important for businesses to understand trends and preferences at a global scale. The challenge was to process vast amounts of data from various, often disparate, sources and to transform this raw data into meaningful, actionable insights. Without effective visualization and analysis, businesses struggle to identify key patterns, regional preferences, and spending habits that are crucial for strategic decision-making and product development.
- Significant changes in the trade landscape due to increasing e-commerce penetration and shifts in consumption patterns.
- Variations in e-commerce adoption between G20 countries, especially between developed and emerging markets.
- Underrepresented focus on consumer purchasing patterns in G20 European countries in existing academic literature.
- Economic factors (e.g., inflation, monetary policies) and infrastructure limitations influencing consumer behavior.
2. The Goal: Empowering Data-Driven Business Decisions
Our primary goal was to create interactive Tableau dashboards that provide easy and intuitive access to complex consumer behavior data. We aimed to deliver clear visualizations of regional preferences, spending patterns, and purchasing behaviors, enabling businesses to filter data by country, income level, and product category. The ultimate objective was to empower businesses with the insights necessary to make well-informed strategic decisions in a competitive global market, improving product offerings and market penetration.
- Investigate consumer purchasing patterns and product preferences in G20 European countries.
- Provide valuable insights for companies to optimize their marketing strategies.
- Enhance company competitiveness and achieve greater success in a competitive market.
- Contribute significantly to global consumer behavior literature.
3. My Role & Responsibilities
As one of the authors of the research paper "Exploration of Consumer Purchasing Patterns and Product Preferences in G20 Countries in the European Region" (alongside Josua Rivo Muin and Rivaldo Yosia Himawan) from the Department of Multimedia, Universitas Nusantara, my role encompassed a significant part of the data analysis and visualization. My responsibilities included exploring sales data, identifying consumer preferences, and understanding influencing factors, which directly involved the use of tools like Tableau to present these insights comprehensively.
- Contributed to the comprehensive analysis of sales data.
- Focused on identifying consumer purchasing patterns and product preferences.
- Explored factors influencing purchasing decisions in G20 European countries.
- Utilized data visualization tools like Tableau to present research findings.
.png)
Figure 2: Initial Data Exploration for Consumer Patterns.
4. Design Process & Solution
Our research methodology involved a systematic approach to data collection, preprocessing, and in-depth analysis to extract meaningful insights from the Europe Sales Record dataset. The entire analytical process was meticulously designed to provide a detailed understanding of market dynamics in the region.
Data Collection & Preprocessing
The dataset used in this research originates from company sales records operating in the European Region, covering the period from January 1, 2010, to July 23, 2017. The data collected includes information on various aspects of sales transactions, such as the country of origin, item type, sales channel (online or offline), order priority, order and ship dates, units sold, and unit price. Data preprocessing involved identifying and removing errors, duplicates, and missing values. Raw data was transformed into a suitable format for analysis (e.g., date conversion to DateTime, numerical values to proper formats). Data grouping was performed based on relevant categories like country, product type, sales channel, and time period, facilitating comparative analysis and trend identification.
Data Visualization & Dashboard Creation with Tableau
Descriptive analysis was performed to provide an overview of the data, including frequency distribution, mean, median, and variance. Data was visualized using charts and diagrams (histograms, pie charts, line graphs) to clearly display analysis results. Tableau dashboards were specifically utilized to provide a comprehensive overview of company profit, sales performance, unit costs, and units sold over the past year in G20 European countries (France, Germany, Italy, Russia, and the UK).
.png)
Figure 3: Interactive Tableau Dashboard Visualizations.
Key dashboards developed and their insights:
- Data Profit Dashboard (4.1): Showcased total sales, profit, and units sold, identifying seasonal sales patterns and top-selling item types. It also illustrated sales trends over time (monthly) and sales channel distribution (online vs. offline).
- Sales Data Dashboard (4.2): Provided future sales forecasts (e.g., 15 months ahead), regional sales maps (e.g., Russia as highest sales region), and sales breakdowns by item type, helping to identify successful products and evaluate marketing campaigns.
- Unit Cost Dashboard (4.3): Analyzed cost per unit, revealing changes over time, comparisons with competitors, and factors affecting costs (raw materials, labor, output levels), aiding in cost savings identification.
- Units Sold Dashboard (4.4): Displayed units sold per country and average price per unit, helping identify popular products, sales trends, and marketing campaign effectiveness.
5. Results & Impact
The analysis of the sales data through various dashboards yielded several important findings. The Data Profit analysis provided a comprehensive view of company profit performance in G20 European countries, offering insights into seasonal sales patterns, best-selling products, and effective sales channel distribution, which is valuable for adaptive business strategies. The Sales Data analysis highlighted future sales forecasts and detailed breakdowns by item type and country, enabling identification of successful products and evaluation of marketing effectiveness. The Unit Cost analysis provided a clear understanding of factors influencing production or service costs, helping identify and manage cost savings opportunities. Lastly, the Unit Sold analysis provided deep insights into sales performance, identifying popular products, sales trends, and marketing campaign effectiveness. This comprehensive understanding is crucial for making informed decisions to enhance overall business profitability and success in the European G20 markets.
- Improved Profitability & Sales Performance: Optimized strategies based on insights into seasonal patterns, best-selling products, and sales channel effectiveness.
- Enhanced Cost Management: Clear understanding of cost factors and identification of savings opportunities, leading to improved operational efficiency.
- Strategic Marketing Decisions: Data on popular products, sales trends, and campaign effectiveness enables more targeted and impactful marketing efforts.
- Deeper Market Understanding: Insights into regional preferences and sales comparisons across G20 countries for market expansion.
Conclusion & Future Outlook
Based on the data analysis, companies can enhance their sales performance and profitability in the European market by optimizing marketing strategies based on findings about popular products and sales trends, paying attention to sales comparisons between countries to expand market share, and evaluating costs to identify savings opportunities. It is crucial to continuously monitor performance to quickly respond to market changes and make necessary strategic adjustments. With a better understanding of consumer purchasing patterns and product preferences, this research is expected to significantly contribute to global consumer behavior literature and help companies achieve greater success in a competitive market.