SAS Visual Analytics: Analyzing Nike Shoe Sales Trends
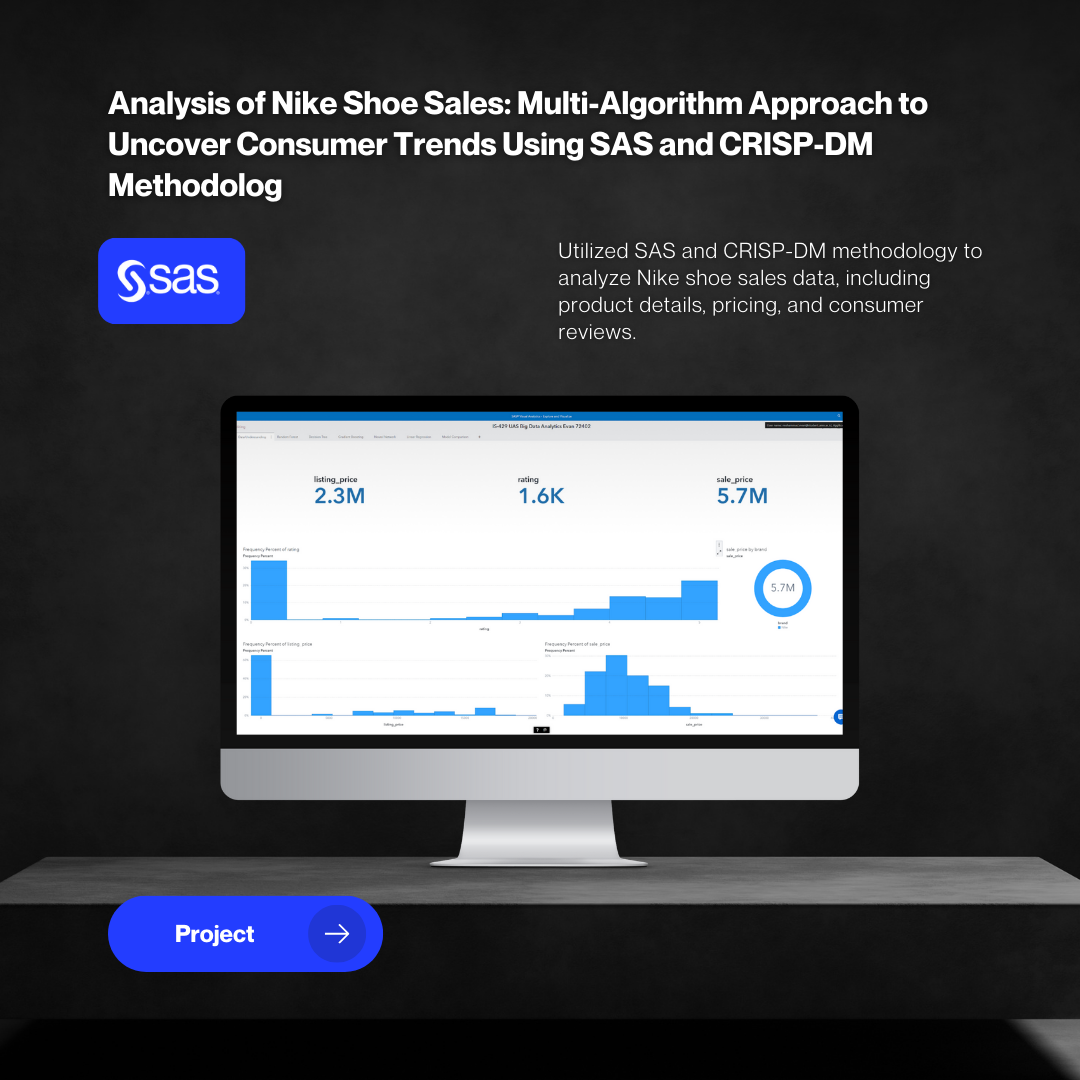
Figure 1: Overview of the Nike Shoe Sales Analysis Project.
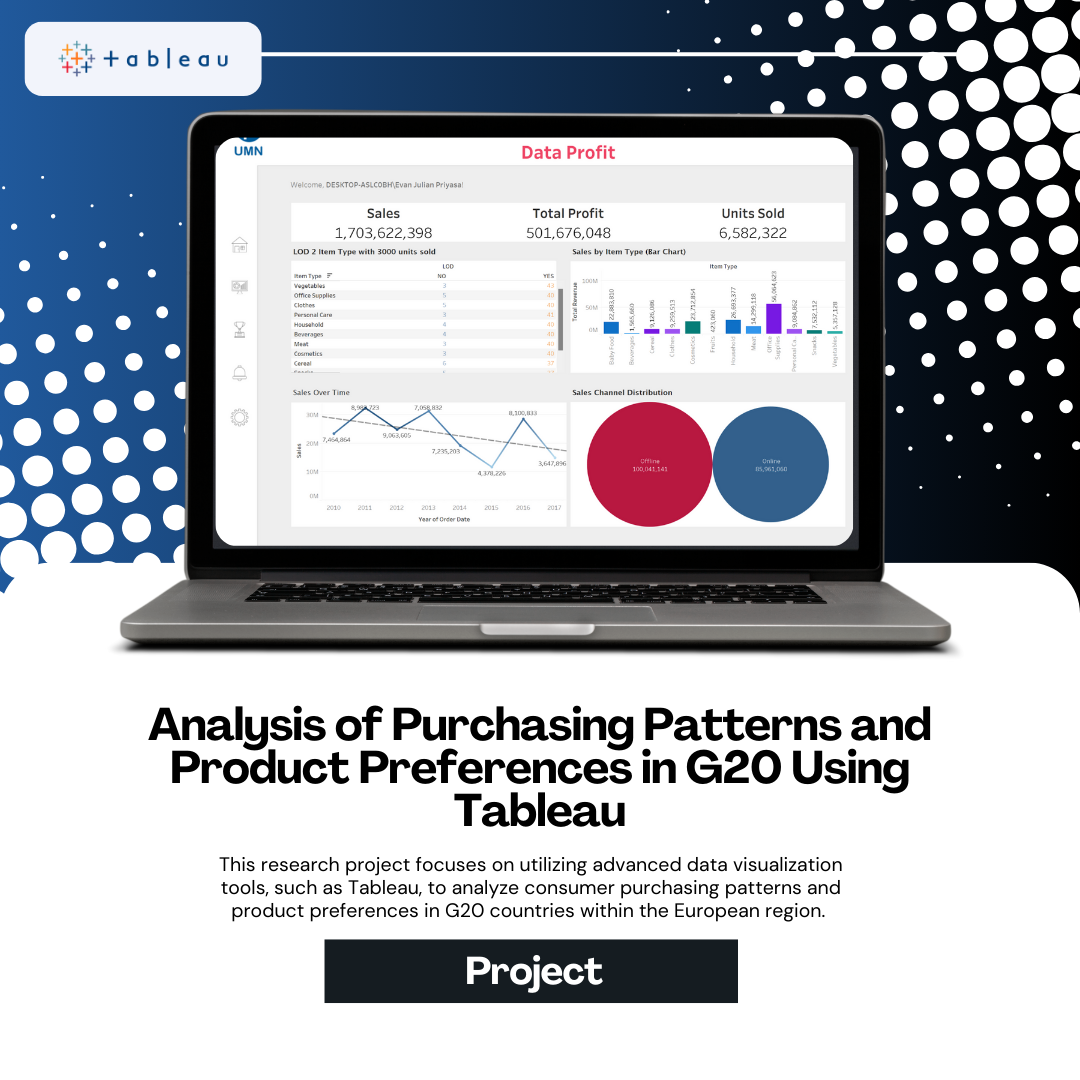
Nike is one of the largest and most recognized athletic shoe brands globally, renowned for its high-quality products and innovative designs. To understand consumer acceptance of Nike shoes, sales data from various online platforms (Nike official website, Amazon, and other retailers) was collected. This data includes product information, pricing, discounts, ratings, reviews, and images. The analysis was conducted using the CRISP-DM method and SAS data analysis tools to identify consumer trends and preference patterns. The results of this analysis are expected to provide useful insights for designing more effective product and marketing strategies, enhancing customer satisfaction, and optimizing Nike's sales.
1. The Problem: Deciphering Complex Consumer Behavior for Strategic Advantage
Understanding how Nike shoes are received by consumers is crucial for strategic decision-making. The challenge lies in extracting meaningful insights from a diverse dataset that includes product information, pricing, discounts, ratings, reviews, and images from various online platforms. Traditional analysis methods may not fully uncover the complex patterns and predictive behaviors needed for effective marketing and product development. In the era of data-driven decision-making, machine learning becomes an invaluable tool to discover intricate patterns and predict consumer behavior, especially in complex sales contexts. The goal is to identify the best algorithms to recognize patterns that reflect consumer behavior through historical data analysis.
- Difficulty in identifying the most popular Nike shoes and features valued by customers without advanced analysis.
- Need to uncover complex patterns and predict consumer behavior from large, diverse datasets.
- Traditional analysis methods may not fully reveal intricate trends for effective strategy development.
- The challenge to find the best machine learning algorithms for classifying sales problems based on historical data.
2. The Goal: Leveraging Multi-Algorithm Machine Learning for Actionable Insights
This research aims to explore the application of various machine learning algorithms, including Decision Tree, Support Vector Machine (SVM), and Logistic Regression (as primary focus), as well as Random Forest, Gradient Boosting, and Neural Networks, in the analysis of Nike shoe sales. By applying the CRISP-DM methodology, our study aims to conduct a comprehensive comparative analysis to understand the factors influencing consumer preferences. The objective is to find the best algorithm for recognizing patterns that reflect consumer behavior through historical data analysis, ultimately helping to design better product and marketing strategies for Nike and other shoe brands, and assisting consumers in making more informed purchasing decisions.
- Apply machine learning algorithms to analyze Nike shoe sales data.
- Conduct a comparative analysis of different models to understand consumer preferences.
- Identify factors influencing purchasing decisions.
- Provide valuable insights for optimizing product and marketing strategies.
- Assist consumers in making more informed purchasing decisions.
3. My Role & Responsibilities
As an author and researcher for the "Nike Shoe Sales Analysis" project (for the UAS IS429 BDA Even Theory 2023-2024 course) in the Department of Informatics, Universitas Multimedia Nusantara, my responsibilities included the comprehensive analysis of Nike sales data. My role involved the application of the CRISP-DM methodology, detailed data understanding and preparation, selection and implementation of multiple machine learning algorithms (Random Forest, Decision Tree, Gradient Boosting, Neural Network, Linear Regression), evaluation of model performance using SAS Visual Analytics, and the interpretation of results to uncover consumer trends. I contributed to all phases of the data mining process, from initial business understanding to model deployment and the final report.
- Explored and understood the Nike shoe sales dataset.
- Performed data preparation, including cleaning and transformation.
- Applied multiple machine learning algorithms for predictive modeling.
- Utilized SAS Visual Analytics for data visualization and model evaluation.
- Contributed to extracting actionable insights on consumer trends and product preferences.
.png)
Figure 2: Data Understanding and Preparation Phase in SAS Visual Analytics.
4. Design Process & Solution
In this research, we applied the CRISP-DM (Cross-Industry Standard Process for Data Mining) methodology, which includes Business Understanding, Data Understanding, Data Preparation, Modeling, Evaluation, and Deployment. This framework provided a structured guide for our data mining project.
CRISP-DM Phases:
- Business Understanding: Defined project objectives and evaluated the business environment, focusing on understanding consumer acceptance of Nike shoes.
- Data Understanding: Collected and explored data from various sources (Kaggle), including `nike_shoes_sales.csv` (644 rows, 10 columns: product_name, product_id, listing_price, sale_price, discount, brand, description, rating, reviews, images). This involved quality assessment and statistical analysis.
- Data Preparation: Involved selection, cleaning (e.g., removing duplicate product names), and transformation of data. A `unique_id` column was added for individual data tracking.
- Modeling: Developed predictive models using SAS Visual Analytics by applying six different algorithms: Random Forest, Decision Tree, Gradient Boosting, Neural Network, Support Vector Machine (SVM), and Linear Regression.
- Evaluation: Compared model results against initial project objectives, assessing performance using metrics like Accuracy, Precision, Recall, F1-score, ASE (Average Squared Error), and R-squared.
- Deployment: Implemented the best-performing models to derive insights and ensure they align with business objectives, ready for practical use.
.png)
Figure 4: CRISP-DM Flowchart for Data Mining Process.
Modeling with SAS Visual Analytics: Multi-Algorithm Approach
We leveraged SAS Visual Analytics to build and evaluate predictive models for Nike shoe ratings. Each algorithm provided unique insights into variable importance and prediction accuracy:
- Random Forest: Showed high performance (99.1% accuracy, 0.99 F1-score) with "reviews" and "AST" as most significant variables.
- Decision Tree: Effectively classified products based on ratings, highlighting important variables like Product ID, Assessment, and Sale Price. Achieved good metrics (78.57% accuracy, 0.7879 F1-score).
- Gradient Boosting: Demonstrated good performance with ASE stabilizing around 0.21, capable of explaining a significant portion of data variance (R-squared 0.7857).
- Neural Network: Performed exceptionally well (ASE 0.0644, R-squared 0.8202), effectively capturing complex variable relationships for precise rating predictions.
- Linear Regression: Excelled in explaining linear relationships (high R-squared 0.932), providing clear and statistically significant predictions with low RMSE (0.1095).
.png)
Figure 5: Various Machine Learning Models and their Visualizations in SAS.
5. Results & Impact
The implementation of various predictive models in Nike shoe sales analysis has provided valuable insights into consumer trends and product rating predictions. Each model, from Random Forest to Neural Network and Linear Regression, contributed significantly to understanding factors influencing Nike shoe ratings, highlighting different data aspects and offering unique insights. The Neural Network and Linear Regression models stood out as the best performers, with Neural Network excelling in complex variable relationships and Linear Regression providing interpretable linear relationships with high accuracy. These insights are invaluable for business decision-makers to understand consumer behavior, optimize marketing strategies, develop products aligned with consumer preferences, and enhance customer satisfaction. The results are crucial for making data-driven decisions to enhance overall business profitability and success.
- Top Performing Models: Neural Network (ASE 0.0644) and Linear Regression (ASE 0.1095) demonstrated superior predictive accuracy.
- Deep Consumer Insights: Uncovered key factors influencing product ratings and purchasing decisions for Nike shoes.
- Optimized Business Strategies: Insights can be leveraged to refine marketing campaigns and product development.
- Improved Profitability: Data-driven decisions support enhanced sales performance and overall business success.
Conclusion & Future Outlook
The use of various predictive models in Nike shoe sales analysis provides deep insights into consumer trends and product rating predictions. While Neural Network and Linear Regression emerged as the best models, the strengths of each model can be utilized to support better business decisions. For future development, key recommendations include enhancing data quality through better cleaning and additional collection, exploring advanced machine learning techniques like Deep Learning for higher data complexity, and integrating these models into existing management systems for real-time operational decision-making. Furthermore, investing in internal staff training for effective model operation and continuously monitoring model performance are crucial to ensure reliability and responsiveness to market changes. By applying these recommendations, the predictive models in Nike shoe sales analysis can become even more effective and generate a more positive impact for the company.