SAS Visual Analytics: Cellular Gadget Sales Analysis for PT GadgetEra

Figure 1: Company Logo
PT GadgetEra is a leading player in the cellular telecommunications industry, operating since 2010. The company is committed to providing innovative network-based communication services that adapt to technological advancements, from the 3G to 5G era. By offering high-speed and low-latency network solutions, PT GadgetEra supports future technologies such as augmented reality (AR), virtual reality (VR), and autonomous vehicles. The company is also known for integrating Internet of Things (IoT) technology and data analytics to enhance connectivity and operational efficiency. For over a decade, PT GadgetEra has continuously invested in network capacity development, energy efficiency, and advanced security systems to protect user data. With a vision to be a pioneer in digital transformation, PT GadgetEra provides strategic solutions for the telecommunications, industrial, and government sectors to remain competitive in the digital era.
1. The Problem: Data-Driven Strategic Decision-Making Challenges
PT GadgetEra faces several key challenges in supporting data-driven strategic decision-making, including:
- Managing Increasingly Large Customer Data: With the rapid increase in mobile service users, the company faces the challenge of processing and analyzing customer data in real-time, including demographic data, sales data, and customer reviews.
- Understanding Customer Behavior: The company needs to understand customer behavior patterns to enhance loyalty, design effective marketing strategies, and meet evolving market needs.
- Discount and Promotion Effectiveness: GadgetEra needs a way to evaluate the effectiveness of discount categories and promotional strategies to maximize revenue and attract more customers.
- Customer Sentiment and Complaint Analysis: GadgetEra faces challenges in understanding customer sentiment through reviews, including identifying complaints related to products, delivery services, or pricing.
- Optimizing Strategic Decision-Making: The company requires a system that can provide data-driven insights to support faster, more accurate decisions focused on improving operational efficiency and customer experience.
- Data and Technology Integration: The company needs integration between internal data and advanced analytical technology to generate comprehensive strategic insights to remain competitive in the telecommunications industry.
2. Data Understanding and Preparation
Two main datasets were used for this analysis: `sales.csv` (before preprocessing) and `GADGETERA_CUSTOMER_DATA` (after preprocessing). Additionally, `GADGETERA_REVIEWS` was used for text analytics.
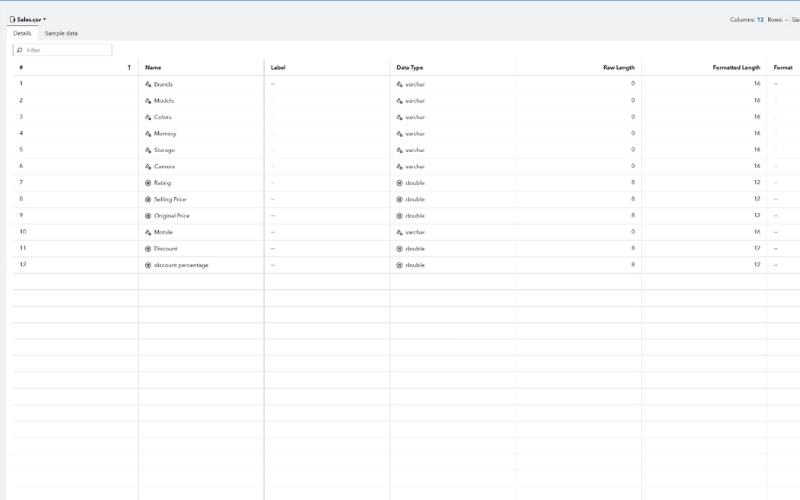
Figure 2: Dataset Before Preprocessing
Dataset `sales.csv` (Before Preprocessing):
This dataset is the initial version of the data used for analysis. It consists of 12 columns and contains basic attributes about products. Its purpose is to serve as the initial input for the preprocessing stage before further analysis.
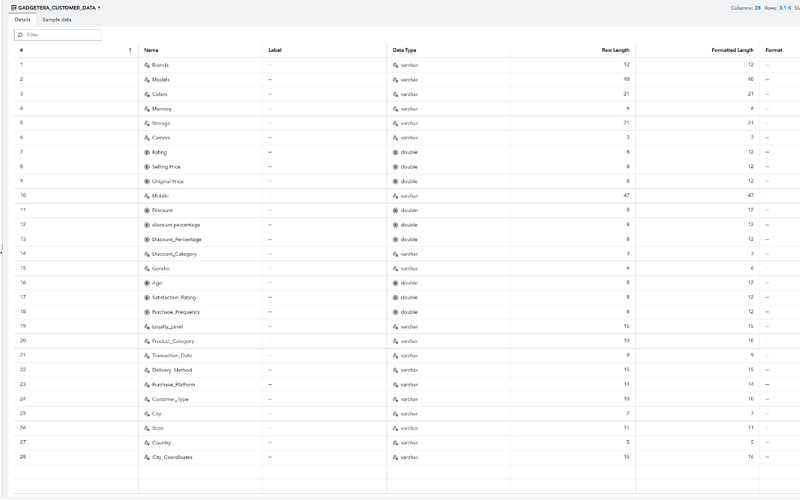
Figure 3: Dataset After Preprocessing
Dataset `GADGETERA_CUSTOMER_DATA` (After Preprocessing):
This dataset is the result of preprocessing `sales.csv` with the addition of several relevant columns for advanced analysis. It has 25 columns covering information such as Brands, Camera, Colors, Memory, Storage, Rating, Selling Price, Original Price, Mobile, Discount, Discount Category, Discount Percentage, City Coordinates, Country, State, City, Customer Type, Purchase Platform, Delivery Method, Transaction Date, Product Category, Loyalty Level, Purchase Frequency, Satisfaction Rating, and Age. This dataset is used for descriptive, predictive, and prescriptive analytics, providing in-depth insights related to sales patterns, customer loyalty, and marketing strategies.
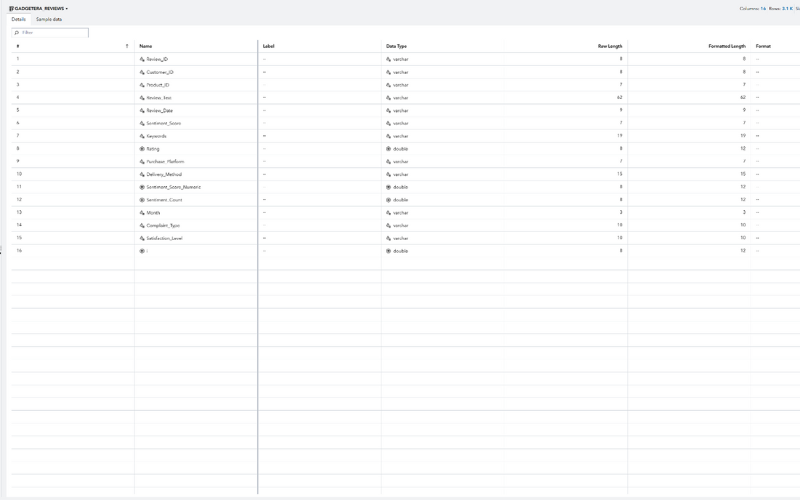
Figure 4: Customer Review Dataset
Dataset `GADGETERA_REVIEWS` (For Text Analytics):
This dataset focuses on text analysis of customer reviews. It consists of 16 columns and includes information such as Review ID, Customer ID, Product ID, Review Text, Review Date, Sentiment Score (Positive, Neutral, Negative), Sentiment Score Numeric, Sentiment Count, Keywords, Rating, Purchase Platform, Delivery Method, Month, Complaint Type (Delivery, Performance, Price), and Satisfaction Level (Very Satisfied, Satisfied, Dissatisfied). This dataset is used in text analytics to identify sentiment patterns, complaints, and customer review trends to improve product and service quality.
3. Visual Analysis Representation
The GadgetEra Dashboard is designed to provide strategic data-driven insights using three main approaches: Descriptive Analytics, Predictive Analytics, and Prescriptive Analytics. These three approaches complement each other to help the company understand current business conditions, project future trends, and provide data-driven strategic recommendations.
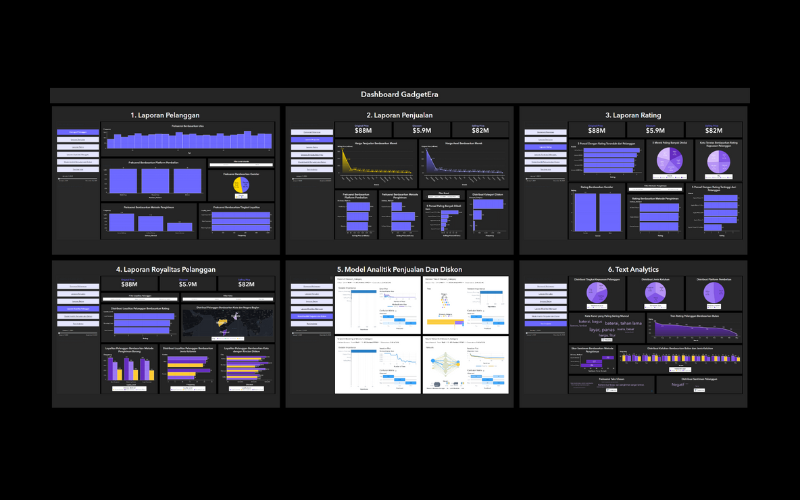
Figure 5: GadgetEra Dashboard
Descriptive Analytics:
Provides insights based on historical data to understand current business performance. Examples include customer reports, sales reports, and rating reports, which show information such as frequency by age, purchase platform, and customer rating distribution. The dashboard measures, monitors, and manages business performance in accordance with the problem analysis.
Customer Demographics Report:
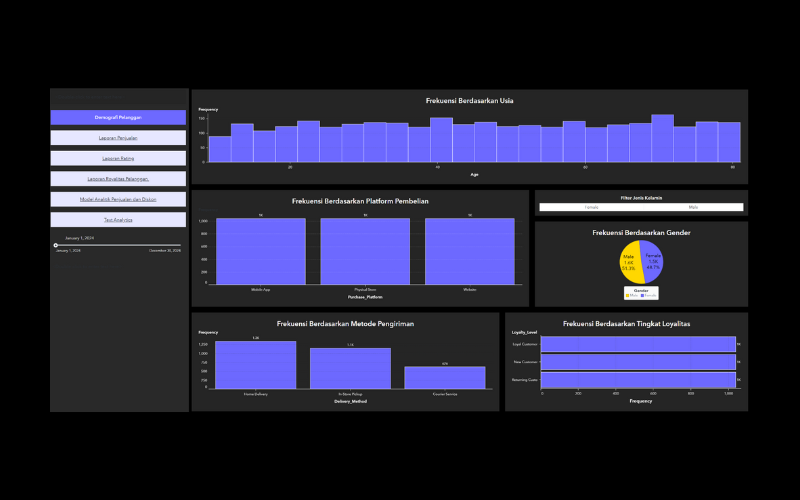
Figure 6: Customer Demographics Report
This dashboard provides in-depth insights into customer characteristics, including age, gender, purchase platform, delivery method, and customer loyalty level.
- Frequency by Age: The histogram shows that the majority of customers are between 20-40 years old, with a peak distribution in their 30s.
- Frequency by Purchase Platform: The bar chart indicates that customer purchase platform distribution is fairly even across Mobile App, Physical Store, and Website, with each platform recording approximately 1,000 transactions.
- Frequency by Delivery Method: Home Delivery dominates with over 1,300 transactions, followed by In-Store Pickup and Courier Service.
- Distribution by Gender: Male customers are slightly more dominant (51.3%) than female customers (48.7%).
- Frequency by Loyalty Level: Shows an even distribution among Loyal Customer, New Customer, and Returning Customer categories, each recording around 1,000 customers.
Sales Report:
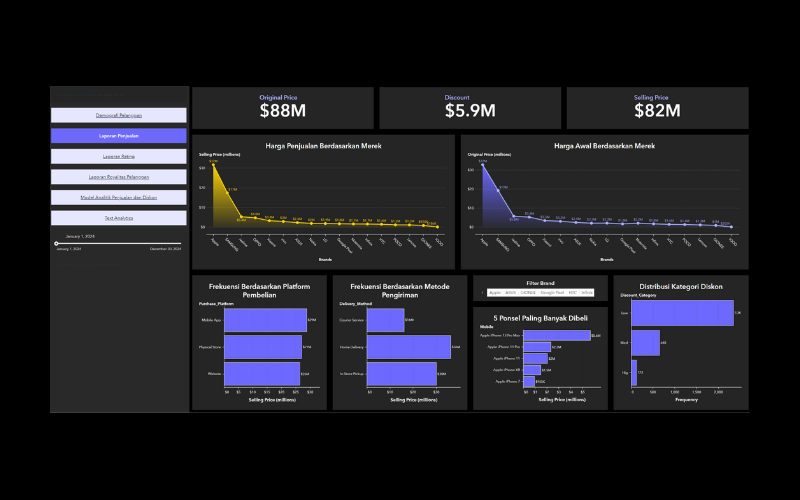
Figure 12: Sales Report
This dashboard provides insights into product sales performance, including information on revenue, discounts, and sales distribution by specific categories.
- Total Revenue Before and After Discount: Initial revenue before discount was $88M, final revenue after discount was $82M, with a total discount of $5.9M.
- Selling Price Distribution by Brand: Apple recorded the highest revenue at $32M, followed by Samsung at $17M.
- Delivery Method Distribution related to Sales: Home Delivery generated the highest revenue at $36M, followed by In-Store Pickup ($30M) and Courier Service ($16M).
- Top Selling Products: Apple iPhone 13 Pro Max was the top seller at $5.6M, followed by Apple iPhone 11 Pro and Apple iPhone 11.
- Discount Category Distribution: Low discount categories dominated with 2.3K products.
Rating Report:
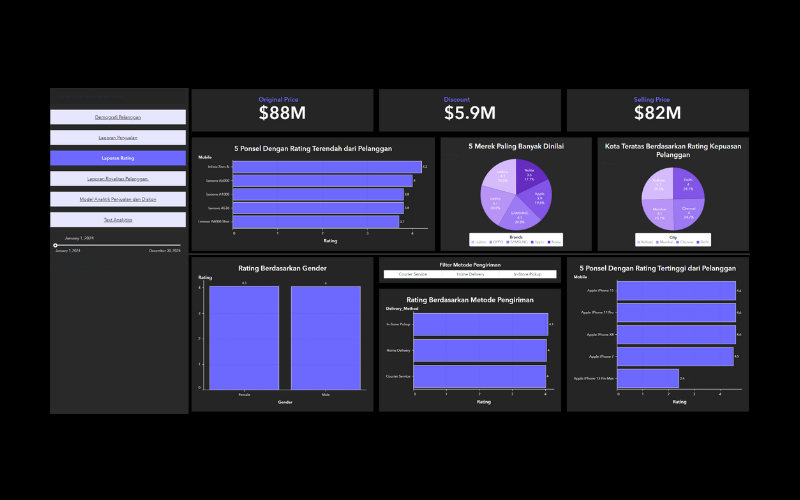
Figure 18: Rating Report
This dashboard provides insights into customer reviews of products, including information on best and lowest-rated phones, most reviewed brands, and rating patterns across various categories.
- Lowest Rated Phones: Infinix Zero 8i had the lowest average rating (4.2), followed by Lenovo A5000 and Lenovo A1000.
- Most Rated Brands: Realme and OPPO dominated with 20.8% each, followed by Samsung and Apple.
- Rating Distribution by Customer City: Kolkata and Mumbai had the largest contributions (25.1% each).
- Rating by Gender: Male and female customers gave the same average rating of 4.1.
- Rating by Delivery Method: Home Delivery had the highest average rating.
- Highest Rated Phones: Apple iPhone 11 and Apple iPhone 11 Pro received the highest average rating of 4.6.
Customer Loyalty Report:
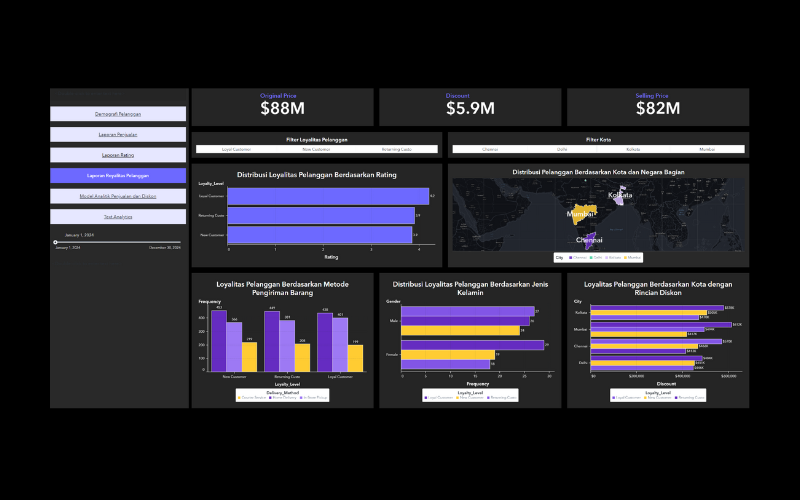
Figure 25: Customer Loyalty Report
This dashboard provides insights into customer loyalty based on various categories such as rating, delivery method, gender, and geographical location.
- Loyalty Distribution by Rating: Loyal Customers had the highest average rating of 4.2.
- Customer Distribution by City and State: Chennai recorded the highest number of loyal customers, followed by Mumbai and Delhi.
- Customer Loyalty by Delivery Method: Home Delivery showed the highest number of loyal customers.
- Customer Loyalty by Gender: Male customers are slightly more dominant in the Loyal Customer category.
- Customer Loyalty by City with Discount Details: Mumbai recorded loyal customers with the highest total discount of $612K.
Predictive Analytics:
Leverages historical data and statistical models to predict future trends and customer behavior. This is seen in the sales and discount analytics model, where algorithms are used to predict discount categories and sales performance based on specific variables.
Sales and Discount Analytics Model Report:
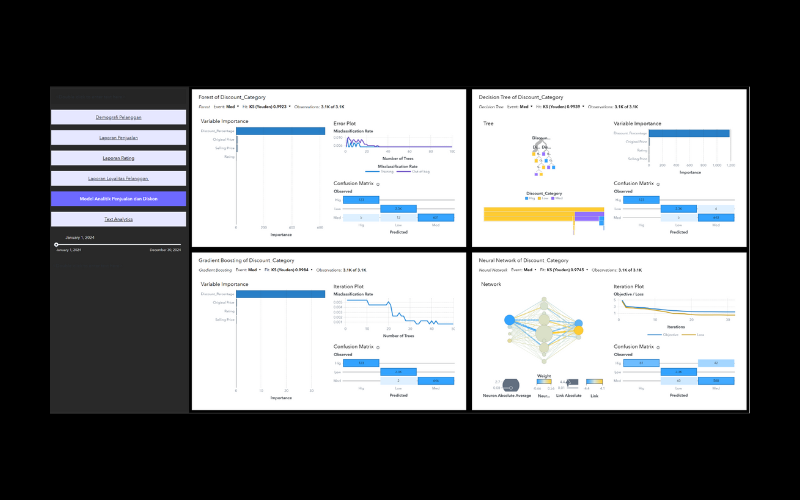
Figure 31: Sales and Discount Analytics Model Report
This dashboard provides predictive insights into sales patterns and discount effectiveness, and evaluates factors influencing discount categories.
- Factors Influencing Discount Category: Variable Importance in models like Forest, Gradient Boosting, and Decision Tree shows that Discount Percentage has the greatest influence.
- Predictive Model Accuracy: Confusion Matrices indicate high accuracy, with most predictions in the correct category. Forest and Gradient Boosting models achieved the best accuracy with very low misclassification rates.
- Iteration Process in Gradient Boosting and Neural Network: Iteration Plots show a gradual decrease in loss, indicating optimal model training.
- Neural Network Structure: The visualization shows a network structure with varying connection weights, providing deeper insights into complex variable relationships.
| Model | Accuracy (%) | Advantages | Disadvantages |
|---|---|---|---|
| Random Forest | 99.3 | Stable, high accuracy, capable of handling high complexity variables. | More difficult to interpret results compared to linear models. |
| Decision Tree | 97.4 | Simple interpretation, tree visualization helps dominant variable analysis. | Prone to overfitting if not well-tuned. |
| Gradient Boosting | 99.8 | High accuracy, performs well on noisy data. | Higher computational time compared to Random Forest. |
| Neural Network | 97.5 | Handles non-linear relationships well, flexible for various data types. | Requires long training time, difficult to interpret without additional visualization. |
Table 3: Summary of Accuracy, Advantages, and Disadvantages of Predictive Models
Conclusion on Best Model: Gradient Boosting is the best model due to its highest accuracy (99.8%), very low misclassification rate, and stable prediction results, emphasizing Discount Percentage as a key factor.
Prescriptive Analytics:
Provides strategic recommendations based on descriptive and predictive analytical results. For instance, based on customer complaint analysis, the dashboard can recommend actions such as improving logistics services during certain periods or developing product features more relevant to customer needs. This helps the company determine the best steps to improve operational efficiency, enhance customer satisfaction, and optimize revenue.
Text Analytics Report:
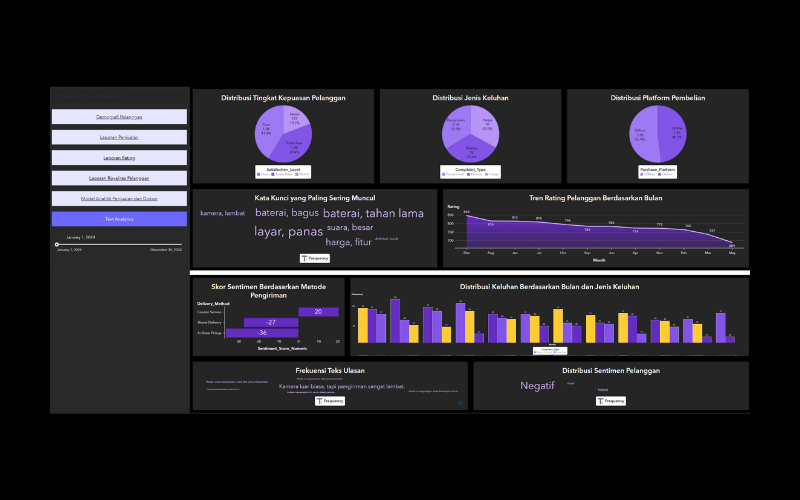
Figure 32: Text Analytics Report
This dashboard provides insights into customer sentiment, complaint types, and review text patterns.
- Customer Satisfaction Level Distribution: Recommendation: Focus on improving the experience of dissatisfied customers (39.4%) through discounts, priority customer service, or product quality improvements.
- Most Frequent Complaint Types: Recommendation: For delivery complaints (33.8%), improve logistics and real-time tracking. For price complaints (32.9%), consider competitive pricing and seasonal discounts. For performance complaints (33.4%), evaluate product quality and make improvements.
- Most Frequent Keywords in Reviews: Recommendation: Focus on developing long-lasting batteries and improving the delivery experience, as these are frequently mentioned issues.
- Customer Rating Trend by Month: Recommendation: Identify rating drops in specific months (April-May) and conduct promotional campaigns or service improvements during those periods.
- Sentiment Score by Delivery Method: Recommendation: Improve the delivery experience for In-Store Pickup and Home Delivery, as negative sentiment scores dominate.
- Complaint Distribution by Month and Complaint Type: Recommendation: Further analyze months with high complaints (July, December) and optimize operations, e.g., by increasing staff to handle customer complaints during those periods.
- Customer Sentiment Distribution: Recommendation: With negative sentiment dominating, focus on in-depth analysis of negative reviews to determine specific steps like product development, more proactive customer service, or brand image campaigns.
- Review Text Frequency: Recommendation: Analyze negative reviews in depth to identify root causes (e.g., battery issues, product design) and implement technical improvements. Optimize logistics, promote product advantages, and continuously monitor sentiment using text analytics.
4. My Role & Responsibilities
As the author and researcher for this project (for the UAS IS529 CL Advanced Big Data Analytics - LAB course), my responsibilities included the comprehensive analysis of PT GadgetEra's cellular gadget sales data. My role involved applying various analytical approaches: Descriptive, Predictive, and Prescriptive Analytics. This encompassed data understanding, preparation, implementation of different machine learning models, evaluation of their performance using SAS Visual Analytics, and interpreting the results to derive actionable insights for strategic decision-making in the cellular gadget industry. I contributed to all phases of the data analysis process, from initial problem identification to model deployment and the final report.
- Explored and understood the cellular gadget sales and customer review datasets.
- Performed data preparation, including cleaning and transformation of the sales data.
- Applied descriptive analytics to generate customer demographics, sales, rating, and customer loyalty reports.
- Developed and evaluated predictive models (Forest, Decision Tree, Gradient Boosting, Neural Network) for sales and discount analytics.
- Utilized text analytics for prescriptive insights on customer sentiment and complaints.
- Contributed to extracting actionable insights and recommendations for business improvement based on the analytical results.
5. Conclusion & Future Outlook
This analysis provided comprehensive insights into PT GadgetEra's cellular gadget sales, customer behavior, and operational efficiency through descriptive, predictive, and prescriptive analytics. The descriptive analysis offered a clear view of current business performance, customer demographics, sales trends, product ratings, and loyalty. The predictive models, particularly Gradient Boosting, effectively identified key factors influencing discount categories and sales, providing accurate forecasts. Lastly, the prescriptive analytics, derived from text analysis of customer reviews, delivered actionable recommendations to address complaints, improve service, and optimize product features.
For future development, key recommendations include:
- Data Enhancement: Continuously improve data quality through better cleaning processes and explore additional data sources (e.g., social media mentions, competitor data) for a more holistic view.
- Advanced ML Techniques: Invest in more advanced machine learning and deep learning models to handle higher data complexity and uncover even more subtle patterns in customer behavior.
- Real-time Integration: Integrate these analytical models into existing operational systems to facilitate real-time decision-making, allowing for immediate responses to market changes and customer feedback.
- Staff Training: Provide continuous training for internal staff on how to effectively use and interpret the analytical dashboards and models, fostering a data-driven culture within the company.
- Continuous Monitoring: Regularly monitor model performance and recalibrate as needed to ensure their reliability and responsiveness to evolving market dynamics and customer preferences.
By implementing these recommendations, PT GadgetEra can further enhance its strategic decision-making capabilities, improve operational efficiency, increase customer satisfaction, and ultimately drive business growth and profitability in the competitive cellular gadget market.